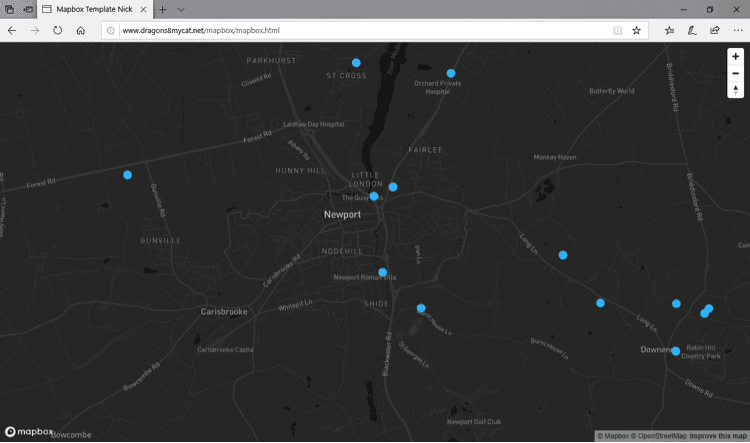
This blog is born out of pure frustration and my competitive nature. When I was looking at web mapping libraries, I looked at Mapbox and thought, “That will be easy.” Three days later I was pulling my hair out—then the next day I was smiling and happy.
You see, Mapbox is similar to Leaflet in that you create an html page and then define your basemap and your data, but it uses its own definitions, and you need a “token” to identify that it is you. You also need to reference the data in the right way.
Well, it got a little frustrating as I had just one error in the template, and no matter how many code changes or methods I used, I just couldn’t get it to run … until I realized that the “token” that I was using was wrong. HMPH!
Anyhow, I have spent the time getting frustrated so that you can simply come along, copy and paste my code, and then tweak it. In the guide below I also show you where each of the bits of information comes from so you don’t feel the pain that I had!
What Is Mapbox
Now, ignore everything I just wrote. Mapbox is, in fact, actually a really flexible and easy library to get up and started with, though it is a little like the game Othello, which advertises itself as, “A minute to learn, a lifetime to master.”
You can use your mapping data in many different data formats like PostGIS and Geojson or upload it to Mapbox and they will serve your data as vector tiles for free up to a certain tier of use. There are some great basemaps available that are provided by Mapbox, and you can also use their Studio tool to refine and polish you own styles.
Mapbox has put cartography at the core of their library; you can do awesome styling effects, like 2.5D, putting 3D models in, shadows, blurs around text or features, essentially everything that you could do with a bigger GIS system without the editing and analysis—this is pure representation.
For this blog we will create a map using data that is uploaded and styled on Mapbox, and we will use an html page to render the map on the web. Please note that I have added line numbers for reference only—if copying the code, take the line numbers out!
Creating a Map
As with other libraries, the web map is defined within the web page (html) and information is called into it. Therefore, first of all, we need to set up the html page.
1 <!DOCTYPE html>
2 <html>
3 <head>
4 <meta charset="utf-8" />
Here we define that the document is html and start the header, then say that we are using the uft-8 character set.
5 <title>Your title here</title><!-- Give your map a title by changing the text between the title tags-->6 <meta name="viewport" content="initial-scale=1,maximum-scale=1,user-scalable=yes" />7 <script src="js/l3tnb.js"></script>8 <link href="css/4682h.css" rel="stylesheet" />
Next, in line 5, we add a title to the map. This will appear in the tab on your web browser.
On this line I have also added a comment (in green). You can add comments in html by starting with “<!–” adding the text and then ending with “–>”. Comments are a great way to remind yourself what bits and pieces of your code do.
Line 6 defines the size and whether the map is scalable. If you want, you can define a specific page size, but in this instance I want it to scale over different devices.
In lines 7 & 8 we align the page to the Mapbox GL JS platform by telling the page to get information from these URLs.
9 <style>10 body { margin: 0; padding: 0; }11 #map { position: absolute; top: 0; bottom: 0; width: 100%; };12 </style>13 </head>
Here we tell the page that the body (content) has no margin and no padding, and then the map (defined as #map) takes up all the space. Then in line 13 we close off the header.
14 <body>15 <div id='map'></div>16 <script>17 mapboxgl.accessToken = 'pk.eyxxxxxxxxxxxxxxxxxxxxxxxxxx'; // Add your Mapbox token in between the apostrophes18 var map = new mapboxgl.Map({19 container: 'map',20 style: 'mapbox://styles/mapbox/dark-v10?optimize=true', // Add your basemap here (use the list: https://docs.mapbox.com/mapbox-gl-js/api/21 zoom: 13, //Add start zoom level22 center: [-1.290356, 50.697739] //Add initial start position of map (in Lat/Lon)23 });24 </script>
Add the Basemap
Now we start to have some fun and add the basemap. Note that the comments are now using “//” — there is no need to end the comment. This is a C++ style comment, but we are using JSON which seems to support these comments.
At the start we define that this is the body of the page and that it has the identity of a map. We then provide our Mapbox access token (this will start with a “pk,e”). This can be found on your Mapbox account page. Don’t worry, it is free to sign up, and the free usage tier is very generous, and then it is relatively cost-effective if your site gets super popular.
In lines 18 & 19 we create a new variable as a new Mapbox GL map.
The next line (20) we define which basemap we are going to use. Mapbox has LOTS of different basemaps, and you can even create your own. The comment links to some of the popular “out of the box” basemaps.
Note that on the end of the URL for the basemap, I have added “optimize=true” — this makes for smaller offline caches and also means that features that aren’t used don’t get loaded. Obviously, take this off if it causes issues for you. I don’t think it works with anything except for vector tiles, either.
Set the Starting Point
Next, in 21 & 22 we set the starting center point for the map. This is stated in EPSG: 4326 WGS84 latitude and longitude (decimal degrees) and then the zoom level.
In my experience, web map zoom level is a bit of a dark art; it may be that I don’t do enough of it, but I found a great resource on the Mapbox website on zoom levels. The crux of it is that zoom level 0 is the whole Earth, then zoom level 10 is for large roads, and 15 is about right for looking at buildings … have a play!
25 <script>26 map.addControl(new mapboxgl.NavigationControl()); // Adds zoom and rotation controls to the map.27 map.on('load', function() {28 map.addSource('historic_landfill', { //Add the layer name here29 type: 'vector',30 url: 'mapbox://yourURLxxxxx' //You can get your url from download of your style31 });
Add Layers
In the next section we start a new script as we want to start to add our layers. First off, in line 26 call on the Mapbox navigation controls; this adds the zoom, tilt, and swivel buttons (try removing line 26 and see what happens!).
Add Data
Now, in line 28, we add the data. In this case it is a layer called “historic landfill” which I loaded as geojson to my Mapbox account as a tileset. I then styled it and, once published, was able to get a url and other information.
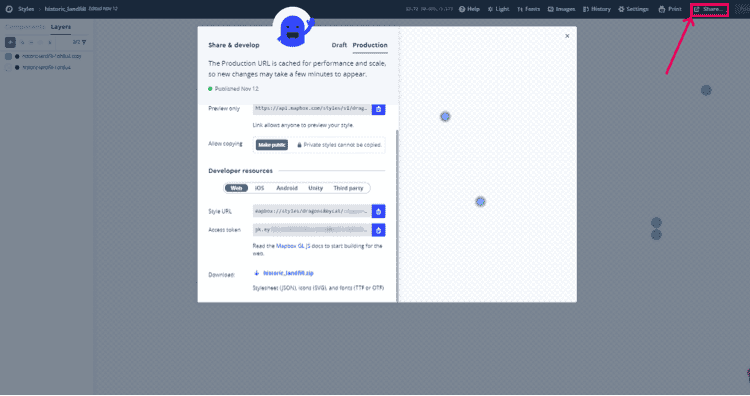
This picture shows the Mapbox Studio interface where you style your data. Here you can see that I have styled my data, and then in the top right I’ve hit the “share” button. Once you’ve hit the share button, you get the URLs and token you need; the layer name you need for line 28 is in the top right (just after the text “style”).
There is the option to also download a zipfile of your style. You will need this to style your data on the map in the next stage.
32 map.addLayer({33 'id': 'historic-landfill-1oh6u4', //Add your layer id (from Mapbox studio or download of style)34 'type': 'circle',35 'source': {36 type: 'vector',37 url: 'mapbox://yourURLxxxxx' //You can get your url from download of your style38 },39 'source-layer': 'historic_landfill-1oh6u4',40 'layout': {41 'visibility': 'visible'42 },43 'paint': {44 'circle-color': 'hsl(198, 100%, 60%)',45 'circle-stroke-width': 8,46 'circle-blur': 0,47 'circle-stroke-color': 'hsla(0, 0%, 0%, 0)',48 'circle-radius': 849 }50 });51 });52 </script>53 </body>54 </html>
Define the Style
So, here we are, the final stretch, here we define the style that we are adding to the data. This can all be obtained from the zipfile we downloaded in the previous step:
The above screenshot is a direct screenshot from the zipfile obtained from Mapbox Studio, and if you look closely, it is almost identical except that apostrophes are used in place of speech marks. The main thing that I tripped over was the reference to “source,” which requires both the layer URL and that it is vector, rather than the term “composite” which is used in the style zipfile.
In fairness, in creating this portion of the html page I used the “replace” tool in Notepad++ to replace the speech marks with apostrophes and then copied and pasted the style.
In lines 53, 53 & 54 I close the script, body, and html.
If you now save the textfile you have created and then change the .txt to .html, you should (if you are using Windows and have your browser set to auto-open html) be able to double-click on that html file, and it will bring up your map!
Putting It on the Web
To put the data on the web, you will need a website or an area accessible via url where you can put data. Many hosting companies like GoDaddy, Wix, and others provide webhosting with CPanel and FTP access. This will allow you to add files on the internet and give them a url.
If you are used to using the folder structure in Windows, then using CPanel through your webhost might be best, but I use the open source software Filezilla as it is real easy and quick to drag and drop data into—and it means I don’t need to open web pages.
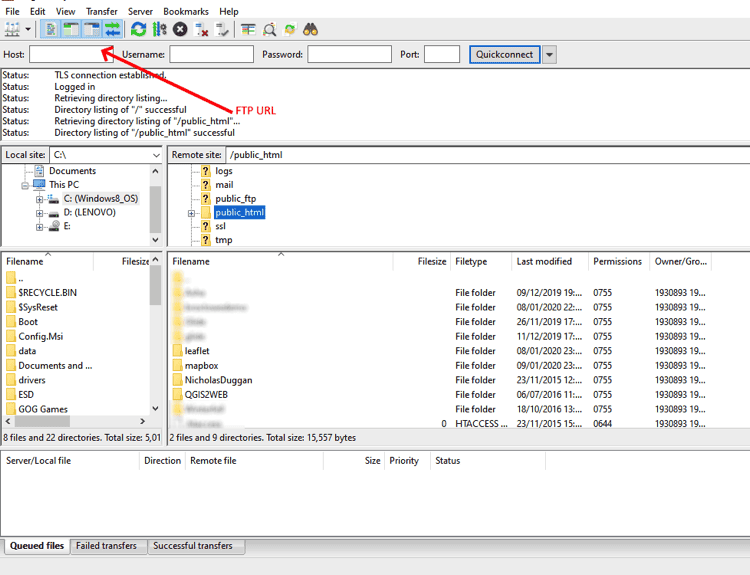
Here you can see the folder structure of my webhost through Filezilla. The box top-right shows the folder and the box below shows the contents. When adding data that needs to be seen on the web, you will need to place it in the “Public html” folder.
Each folder you add in to your “Public html” folder will create a new sub area.
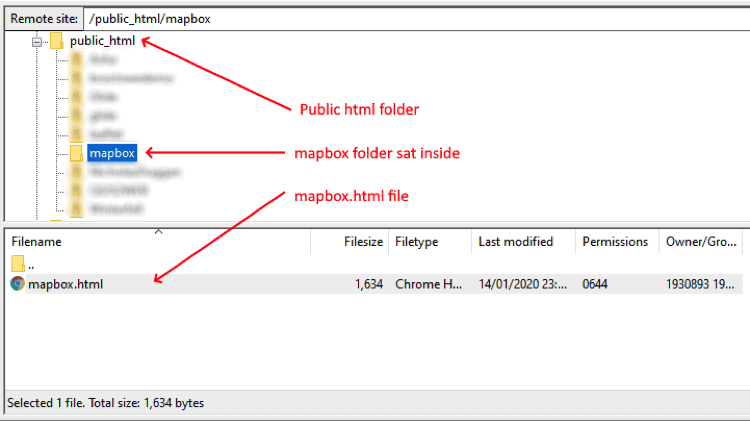
Let me explain. I own https://dragons8mycat.net, and if I add a folder called “leaflet,” the contents of the leaflet folder will be within https://dragons8mycat.net/leaflet. Therefore, if I wanted to put my Mapbox map on the internet in an area called “mapbox,” and I wanted people to open the html which I called “mapbox.html,” then I would create a folder called “mapbox” and within it put the html file. I would then drop that into my “Public html” folder. People would then be able to go on the internet and go to http://dragons8mycat.net/mapbox/mapbox.html
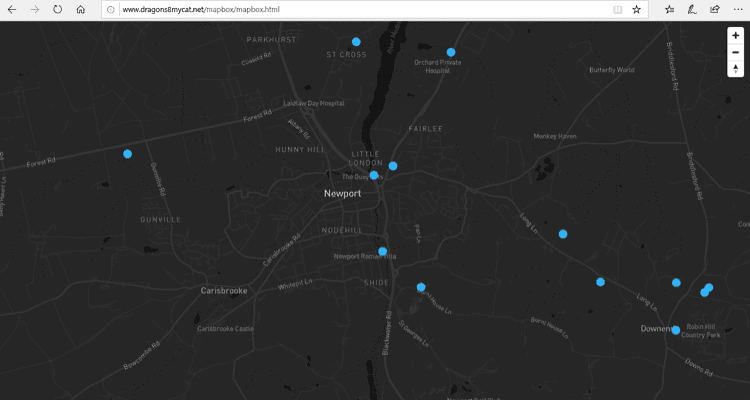
The above image is a screenshot of my Filezilla software. The image below is from the map as hosted. Note that the web URL references the folder structure used.

